
 WebProof is an online proofing service, and because it’s all done online, all printing is removed from the proofing process and in this way reduce CO2. We do our utmost to be a Carbon Free Footprint company so we can help fight global warming.
We saw this article from The Washington Post today and found these 4 graphs especially informative, so we wanted to share it with you.
 The intent of the United Nations — the diplomatic phoenix that emerged from ashes of World War II — was that countries would have a central place to come together and address important issues. For a variety of reasons, the U.N. has rarely upheld that vision. But the gathering getting underway in Paris this week, the 21st annual convening to address the problem of climate change, offers a chance for the U.N. to actually do what it was intended to do: Bring countries together to solve a mutual problem with multiple culprits. Of course, they’ve tried 20 times previously.
The most famous previous gathering of the parties to the United Nations Framework Convention on Climate Change was in 1997, in Kyoto, Japan. The attendees agreed to what became known as the Kyoto Protocol, which would have limited the production of carbon dioxide by signatories beginning in 2005. While the protocol is largely known in the United States because it became a point of contention early in the administration of George W. Bush, it has been implemented by other countries in the years since.
But the problem of carbon dioxide building up in the atmosphere — one of the main reasons that the atmosphere is trapping heat, according to climate scientists — has only gotten worse. In April 1995, carbon dioxide was present in the atmosphere at 363.23 parts per million. Last month, the figure was 398.29, just less than the 400 ppm number that has long been an upper limit to what’s viewed as acceptable.
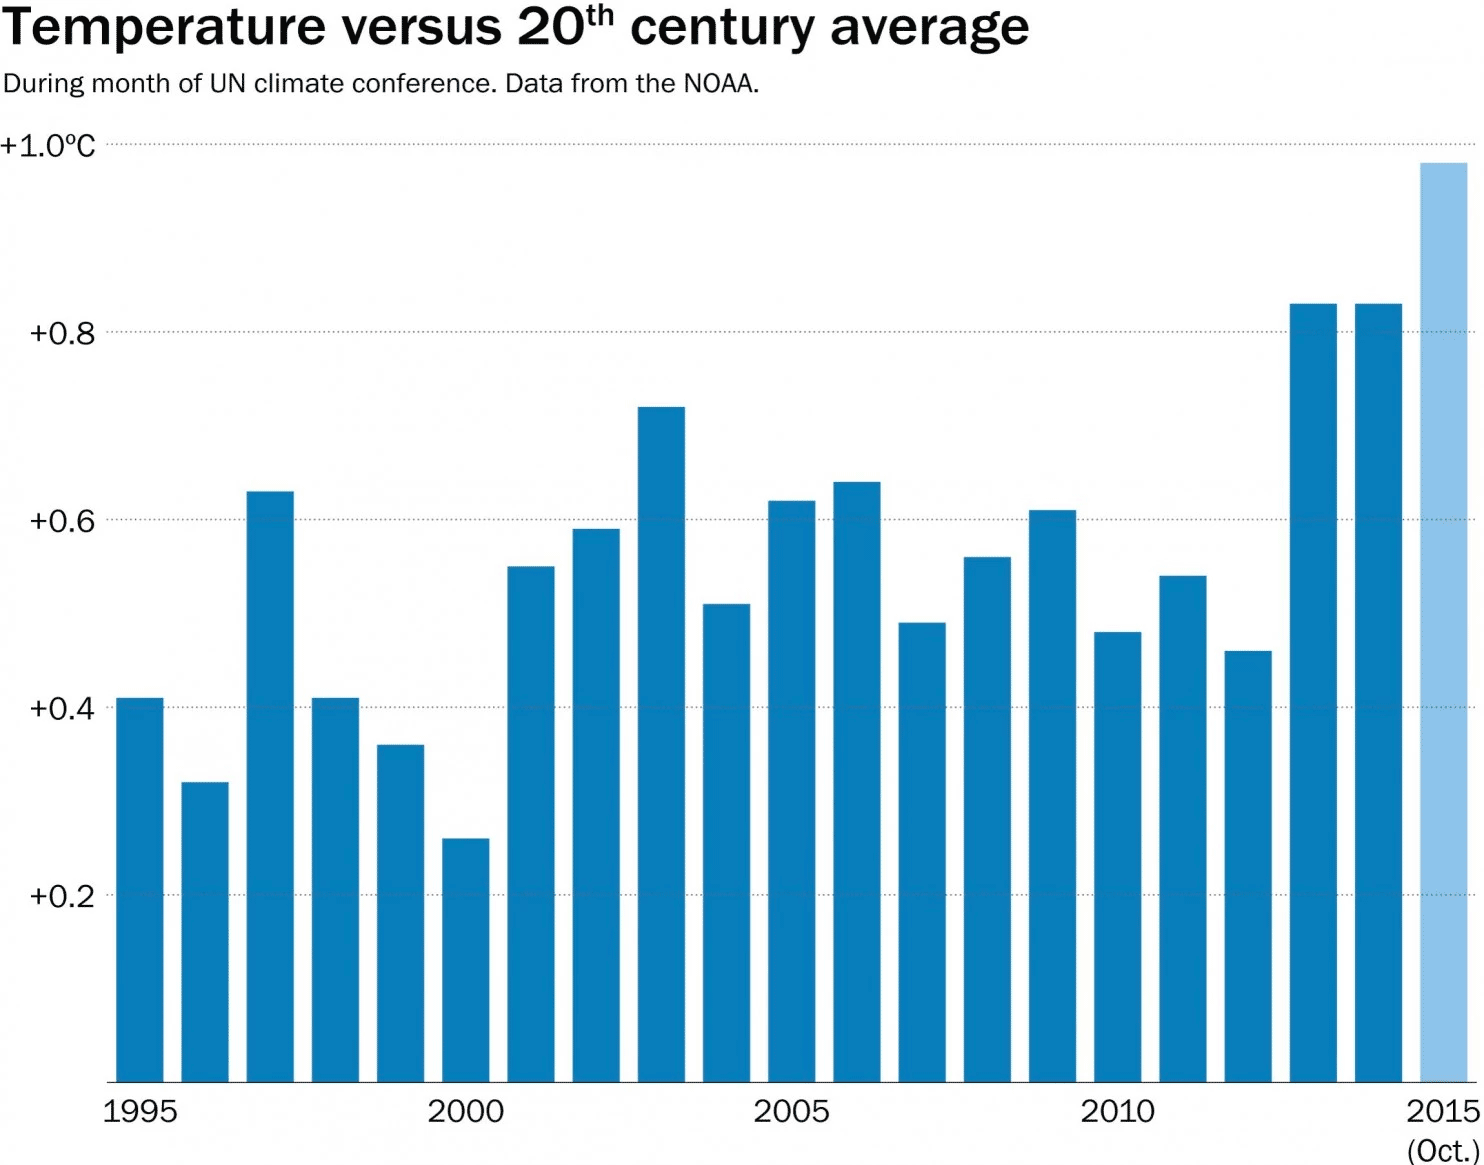
What’s more, the last two conferences of parties (COP) have been during unusually hot months. Every month hosting a COP has been warmer than the month would have been during the same month in the 20th century — but recent conferences have been exceptionally warm. This year’s is poised to be similar.
The main problem being addressed at the Paris gathering, as is usually the problem, is figuring out how to build a mechanism that will reduce carbon dioxide output fairly across multiple counties. The countries of the world do not all produce carbon dioxide at the same amounts. Most greenhouse gas emissions come from electricity production and other fossil-fuel burning, and China has recently surged into the lead as the most polluting nation on Earth.
 As a function of population, though, the United States produces far more carbon dioxide than most other countries.
 But a large amount of emissions also comes from smaller countries.

The challenge before the U.N. is figuring out how to get the big countries to scale back their emissions while not unduly hobbling smaller (and often growing) countries by limiting the amount of electricity they can produce. Many of the countries participating in the conference have submitted pledges of how they’d limit their own pollution. But those pledges themselves will not be enough to keep global warming within limits scientists consider crucial. (That benchmark is an increase of 2 degrees Celsius above pre-industrial levels.)
This year’s conference has taken on special significance for two reasons. First, it comes as President Obama has made a concerted effort to address the problem of climate change — and as he nears the end of his term. Second, the urgency of the problem is becoming more apparent as the world continues to set new temperature records.
The United Nations was created mostly to prevent wars. This week in Paris, the organization will tackle a much different, but much more widespread crisis.
By Philip Bump in The Washington Post, November 30, 2015.
————————————-
You support a CO2-free environment by using WebProof, because WebProof makes every possible effort to improve the environment.
Using WebProof online proofing rather than traditional printed proofs, you save the many trees it takes to produce the paper, and you avoid the subsequent disposal of these paper prints, including toner and ink. In both cases, you avoid emitting a lot of CO2 into the atmosphere.
Last year more than 5 million pages were approved through WebProof. If three people were involved in each proof, this would result in 15 million printed pages. If none of these users printed these pages out, but instead accepted them online, each year we would save:
– close to 2,000 trees
– close to 400,000 kg CO2
In addition, if you use WebProof you help to plant new trees, as WebProof plants a tree every month for every customer we have. After 10 years you will have planted 120 new trees, and WebProof will have planted 120,000 trees for our 1,000 customers. We can all help the world to a better future by using WebProof to read and approve proofs online.
WebProof – Carbon Free Footprint
Get for free, WebProof.